Another group-exercise
Here another post of the series about group-exercises to teach sustainability. Why group exercises? Check my previous post to learn about problem based learning and how teaching is done at Aalborg University.
System analysis with causal loop diagrams
This exercise is usually done in the context of a lecture about sustainability. The point I use to make is that every time we talk about sustainability we also end up talking about systems (and values, and other things, but let’s focus on the systems). And every time we talk about systems we end up talking about models. So one may want to understand what a model is, and what a system is, in order to understand what sustainability is. A great way of learning these things is working with causal loop diagrams.
Another element of my rationale is that sustainability is a difficult concept to communicate and explain. Try writing a short but precise definition of sustainability and see what happens. Yet stories and narratives are effective tools to convey the feeling and idea of what sustainability is. The Easter Island story is for example used in the Sustainability Science1 book.
Summing up, combine system thinking and narratives and you get this exercise.
To be honest, I should also say that in developing it I was much inspired by the findings of the RESPONDER EU project, where causal loop diagrams are used in stakeholder workshops to achieve a common understanding of complex problems. Yes, this is very much like in the case of the scenario development exercise of my previous post!
So how does the exercise work?
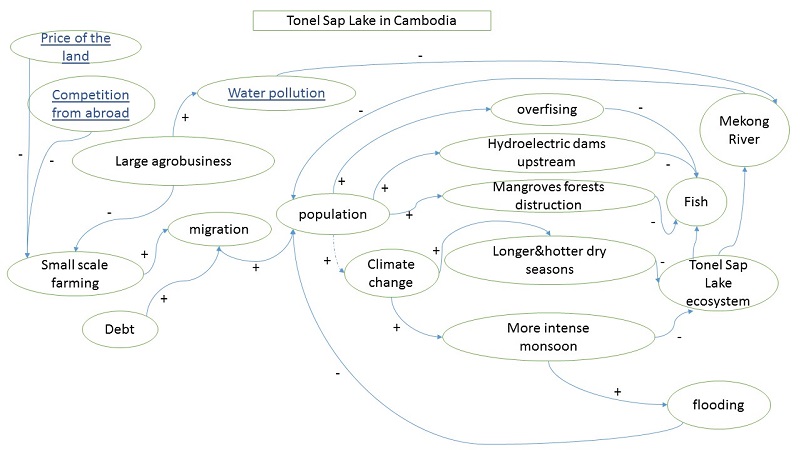
The above mentioned concepts of sustainability, narratives, etc. are introduced to the students. Then I explain how a causal loop diagram works using basic examples from Bossel2. Then students are divided into groups (4-6 students). Each group is given a newspaper article to read, for example this one about Cambodia’s Tonle Sap Lake. I have a collection of articles similar to this one, that I call sustainability stories.
The group develops a causal loop diagram as a model of the system(s) described in the article. Students are also given a short list of simple guiding questions like reflect on what is the main problem described in the article… that facilitate the task. Each group prepares a digital version of the diagram (power point or just by taking a picture with a mobile phone). I show the diagram to the class and in turn each group tells their story to the other groups using the diagram only as guide. The other students make comments and ask questions.
We conclude with a plenum discussion and reflection on the exercise. What was more/less interesting/challenging? I have done this various times and typical issues are agreeing on which elements the diagram should include, their names, the links between them, their direction, the causality, etc. I really like this exercise.
Optionally, sometimes I add an extra step where I ask students to move from a qualitative model to a quantitative one. This means finding possible units and even numbers for each element of the system (both nodes and connections), and eventually changing, modifying, or simplifying the model. The level of difficulty at this point increases almost exponentially even for students with good quantitative skills. Sometimes the entire model has to be redesigned.
Summing up on this system thinking exercise
This exercise addresses, in his own way, sustainability, modelling, and system thinking. A key point of this exercise is that the process is more important than the result. So in the end it doesn’t matter how visually appealing or formally correct a causal loop diagram is. The important is going through the system thinking and modelling process and reflecting on it.